070. Simple regression and correlation analysis. Introduction
Many empirical studies rely quite heavily on regression and correlation analysis. These tools are perhaps the most commonly used forms of statistical analysis, and the invaluable when making a large number of business and economic decisions.
Regression and correlation analysis recognize that they may be a determinable and quantifiable relationship between two or more variables. That is, one variable depends on another and can be determined by it; or one variable is a function of another. This can be stated as
Y = F(X) (7.1)
Since Y depends on X, it is the Dependent variable and X is the Independent variable.
Example. Distinction between the dependent and independent variables in the business world.
A firm’s sales depend, at least a part, on the amount of advertising that it does. Sales is seen as the dependent variable and is a function of the independent variable, advertising. In this manner, advertising can be used to predict and forecast sales. The dependent variable Y is also referred to as the Regressand or the Explained Variable, while the independent variable X is called the Regressor or the Explanatory Variable.
Regression and correlation are two different but closely related concepts. Regression is a quantitative expression of the basic nature of the relationship between the dependent and independent variables. Correlation determines the strength of the relationship.
Simple regression holds that the dependent variable Y is a function of only one independent variable, as indicated in formula (7.1). It sometimes called Bivariate analysis because only two variables are involved - one dependent and one independent.
It is also important to distinguish between Linear and Curvilinear regression. Linear regression attempts to depict the relationship between X and Y by a straight line. This procedure is based on the contention that a change in X is accompanied by a systematic change in Y, which can be represented by a line. Curvilinear regression is used if the relationship can better be described by a curve.
Thus, If X and Y are related in a linear manner, then, as X changes, Y changes by a constant amount. If a curvilinear relationship exists, Y will change by a constant rate as X changes.
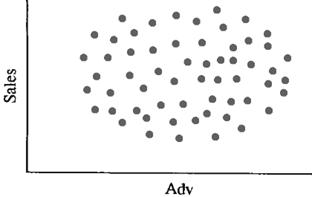
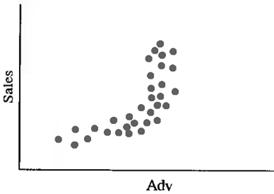
The nature of linear regression, as well as the manner in which it differs from curvilinear regression, can be best illustrated by the Scatter diagrams (fig. 7.1). Scatter diagrams plot the paired observations of X and Y on a graph. Customarily, the dependent variable is placed on the vertical axes, while the independent variable is on horizontal axis.
|
A |
|
|
|
D |
Figure 7.1 – Linear and Curvilinear Relationships:
A – direct or positive linear relationship; B – negative or indirect linear relationship; C – no relationship exists between two variables; D – curvilinear relationship
The objective of regression analysis is to develop a line that passes through the scatter diagram and best represents the data points. Most of this chapter will focus on Simple linear regression.
| < Предыдущая | Следующая > |
|---|

 B
B C
C